










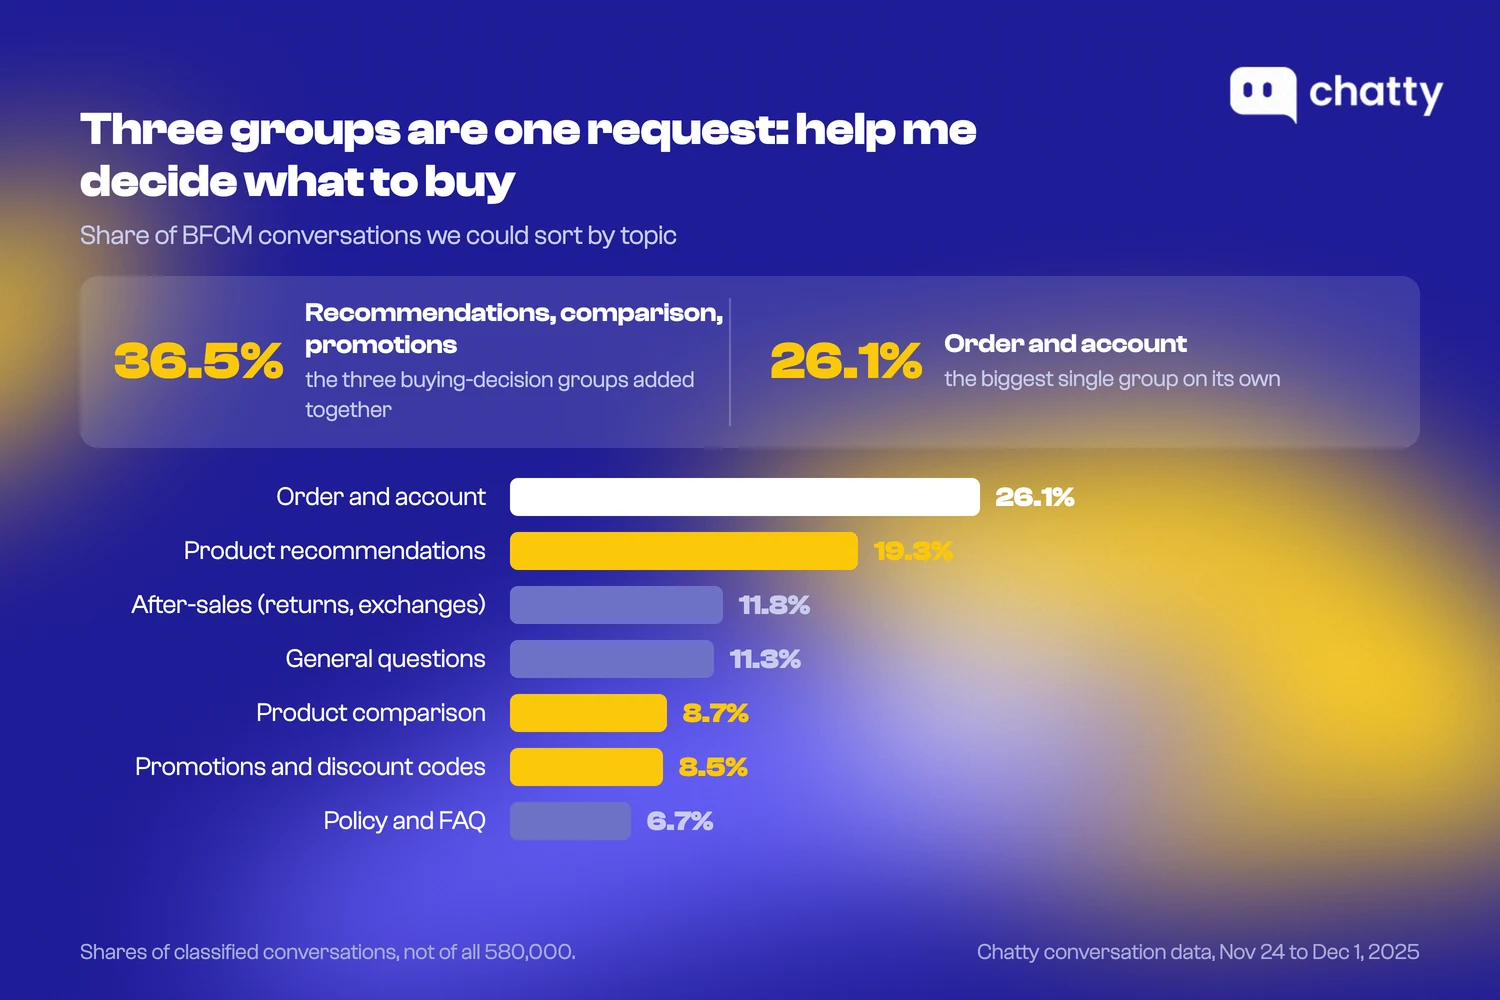
During a sale, the questions your store gets sort into seven groups.
The largest single group is about an order someone already placed. "Where is my order?" "Can I change the delivery address?" "Can I still cancel?" At 26.1% of every conversation we could sort by topic, no other group comes close on its own.
That is also the group most stores spend the season getting ready for: order-status replies, shipping cutoffs, an extra pair of hands on the inbox for the week.
But three of the other six groups are one request in different words, help me decide what to buy. "Which one should I get?" "What's the difference between these two?" "Is there a discount code?" Put those three together and they reach 36.5%, more than the biggest single group (Chatty conversation data, Nov 24 – Dec 1, 2025).
Most stores spend the season preparing for that 26.1%.
The numbers, first
Six numbers from the eight peak days, before any of the reasoning:
- 36.5% vs 26.1%. The three buying-decision groups together are larger than the biggest single group, questions about an order already placed.
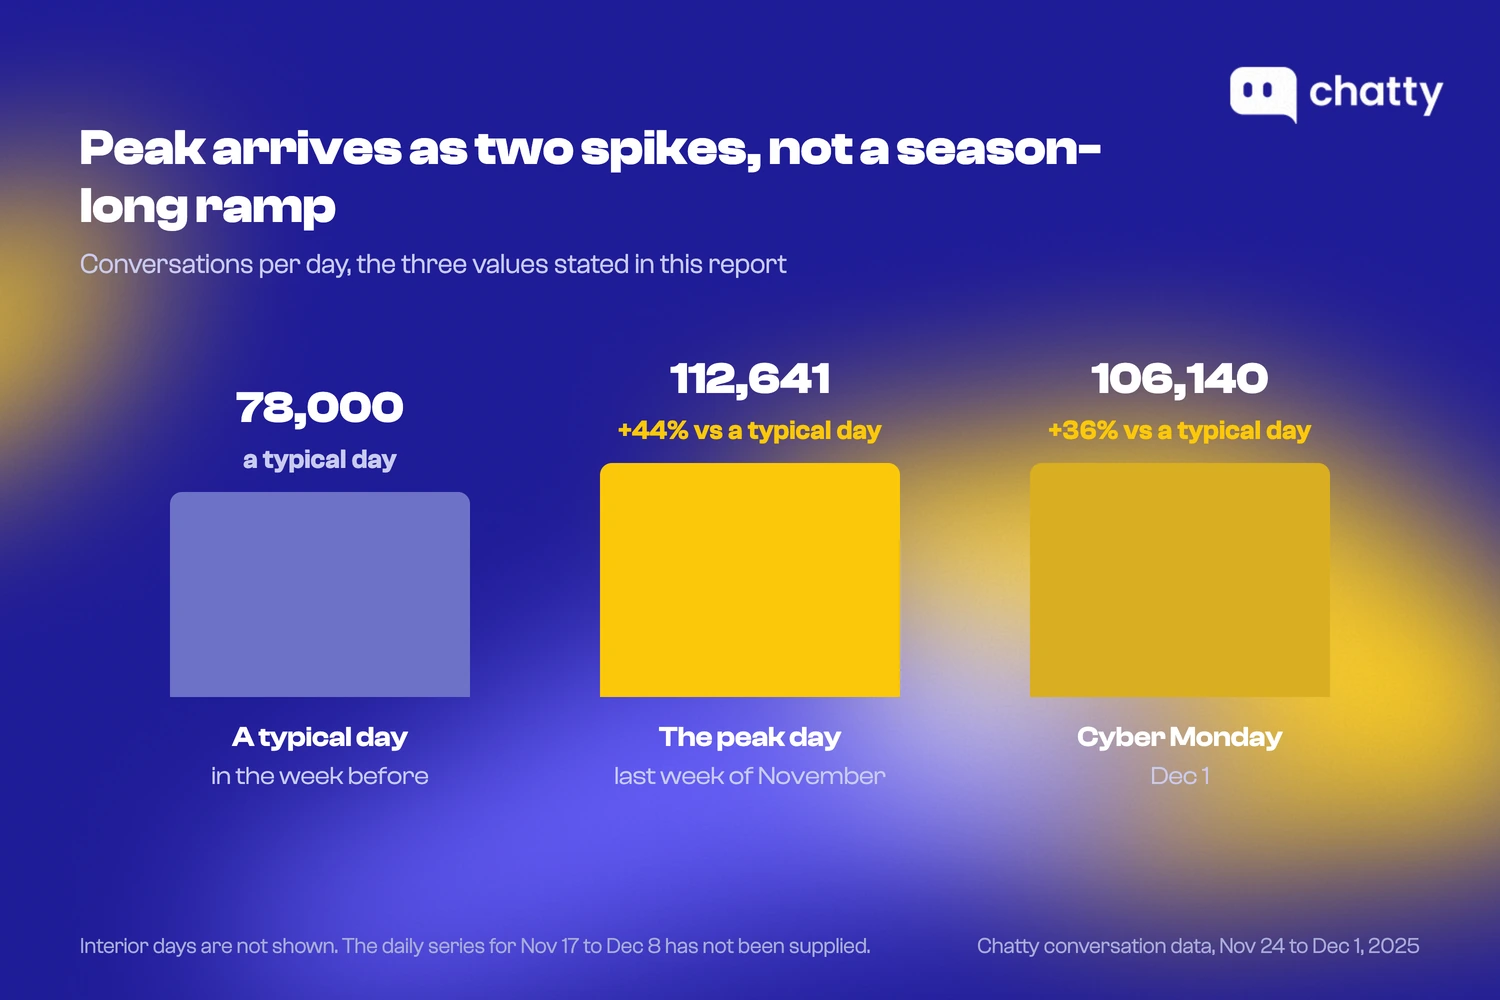
- +44% in one day. In the last week of November, one day hit 112,641 conversations against a baseline near 78,000 a day.
- 53% of conversations landed outside 9am to 6pm UTC.
- 83.9% arrived in the chat widget on the store itself.
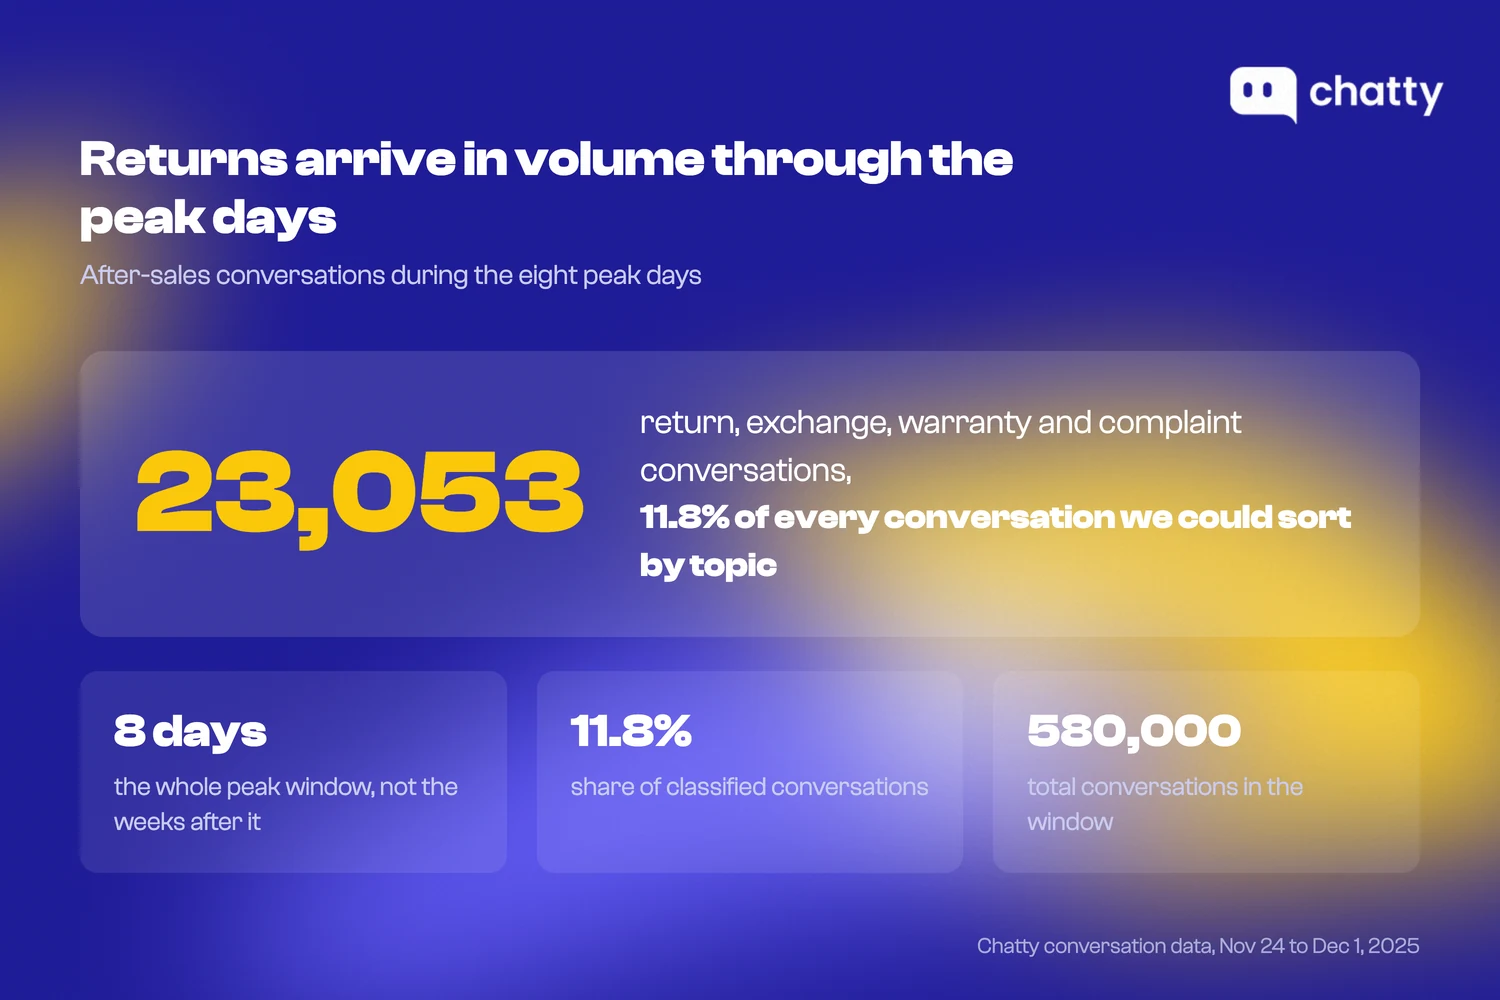
- 23,053 after-sales conversations, meaning returns, warranty and complaints, in eight days.
- Satisfaction 77.2% to 66.3% in BFCM week, measured across stores.
(Chatty conversation data, Nov 24 – Dec 1, 2025)
Six things the 2025 peak season showed
Every insight below comes from the same set of conversations, and they run in order through the stages a shopper moves through, from picking a product to sending one back. Each one is expanded in its own section further down, in the same order.
| # | Insight | What the conversations show |
|---|---|---|
| 1 | In peak season, chat is where shoppers work out what to buy | 36.5% buying questions against 26.1% order and account questions |
| 2 | Peak pressure arrives as two spikes, not a season-long ramp | 112,641 conversations in a single day in the last week of November, +44% over a baseline near 78,000 |
| 3 | More than half of all questions arrive outside business hours | 53% land outside 9am to 6pm UTC |
| 4 | Shoppers do not switch channels when the sale starts | 83.9% in the on-site widget, barely changed from the 30 days before |
| 5 | Returns and exchanges arrive in real volume through the peak days | 11.8%, or 23,053 conversations, in eight days |
| 6 | Shoppers were less satisfied in the exact week they asked the most | 77.2% to 66.3% in BFCM week |
(All figures: Chatty conversation data, Nov 24 – Dec 1, 2025. Topic shares are of classified conversations.)
1. Shoppers ask so they can buy
Peak season turns your chat into the last step of the sale rather than an order-tracking desk. It is where a shopper decides between two products at 10pm with a discount code open in the other tab.
Three question groups are really one request. Product recommendations came to 19.3% of classified conversations, product comparisons to 8.7%, and promotions or discount codes to 8.5%.
Together that is 36.5%. Order and account questions came to 26.1%, the largest single group on the list and still smaller than those three combined (Chatty conversation data, Nov 24 – Dec 1, 2025).
One caution on that 26.1%. Order and account is a wide label. It holds address changes, cancellations, stock questions and add-to-cart help, not only "where is my order".
Shoppers say the same thing when you ask them directly. Attentive surveyed 600 US shoppers and found 58% ask an AI chatbot about a specific product, 51% compare brands, products or features, and 45% ask for a recommendation (Attentive Consumer Pulse, July 2026). One method asked people what they plan to do. The other counted what they did.
What to do with this insight
- Ask your own chat the five questions a first-time buyer asks. Open your store on your phone and type each of these:
- "Which one should I get?"
- "What's the difference between these two?"
- "Will this fit me?"
- "Does this work with the one I already have?"
- "Is there a cheaper option that does the same thing?"
Count how many come back with a real answer instead of a link to a collection page. That count is where you start. If your chat runs on Chatty, the Test AI zone loads a Product Recommendation question set for exactly this, so you can run the check without touching your live storefront.
- Put those answers on your FAQ page, not just in your product descriptions. A product description describes one item. A buying question compares two. Your FAQ page and your saved replies are where "which one should I get" lives, and in most stores they hold only shipping, returns and payment.
- Write one paragraph for every pair of products people mix up. You already know which pairs they are: the two your team keeps explaining. One paragraph each, on both product pages and in the answers your chat can reach. A Japanese apparel brand using this kind of setup put it simply: "It understands our brand's complex sizing and can automatically recommend options to customers."
Go deeper:
- AI product recommendation chatbot
- Product recommendation examples
- Help center: Product recommendations skill
2. Peak is two days, not a season
Plans built around "a busy November" miss where the load actually sits. The pressure arrives twice, hard, and then leaves.
Conversation volume sat near 78,000 a day in the week before. Then, in the last week of November, one day hit 112,641, up 44%. The second spike, on Cyber Monday, came in at 106,140. Both times, volume dropped close to baseline within two days (Chatty conversation data, Nov 24 – Dec 1, 2025).
Money did not move on the same clock. Klaviyo reported that spending shifted later in the window, with Cyber Sunday the strongest year-over-year growth day at +14% (Klaviyo BFCM 2025 Recap). Do not force those two into one story. One counts revenue, the other counts messages. Revenue may be moving later in the weekend. The questions are not.
What to do with this insight
- Give each of the five days one job. Wednesday and Thursday: finish and lock your answers. Friday: change nothing, just watch. Saturday and Sunday: read what your chat couldn't answer and fix it. Monday: the second rush arrives already patched.
- Put your staffed hours on two dates, not across the month. Volume sits near normal until the first spike and is back near normal two days later. Coverage spread evenly across November mostly covers ordinary days.
- Block two hours on the Saturday for a "what did we miss" review. The dip between Friday and Monday is the only window you get. Read what your chat couldn't answer on Friday, write those answers, publish them before Monday repeats the rush.
Go deeper:
3. Over half the questions arrive after hours
Coverage is the quiet half of peak planning. 53% of BFCM conversations landed outside 9am to 6pm UTC (Chatty conversation data, Nov 24 – Dec 1, 2025), so more than half of them arrived outside one standard business day.
Read that 53% as a shape, not as your number. The window pools stores in every time zone, so it says the questions spill well past business hours. It does not tell you what hour your shoppers write. Only your own store can tell you that.
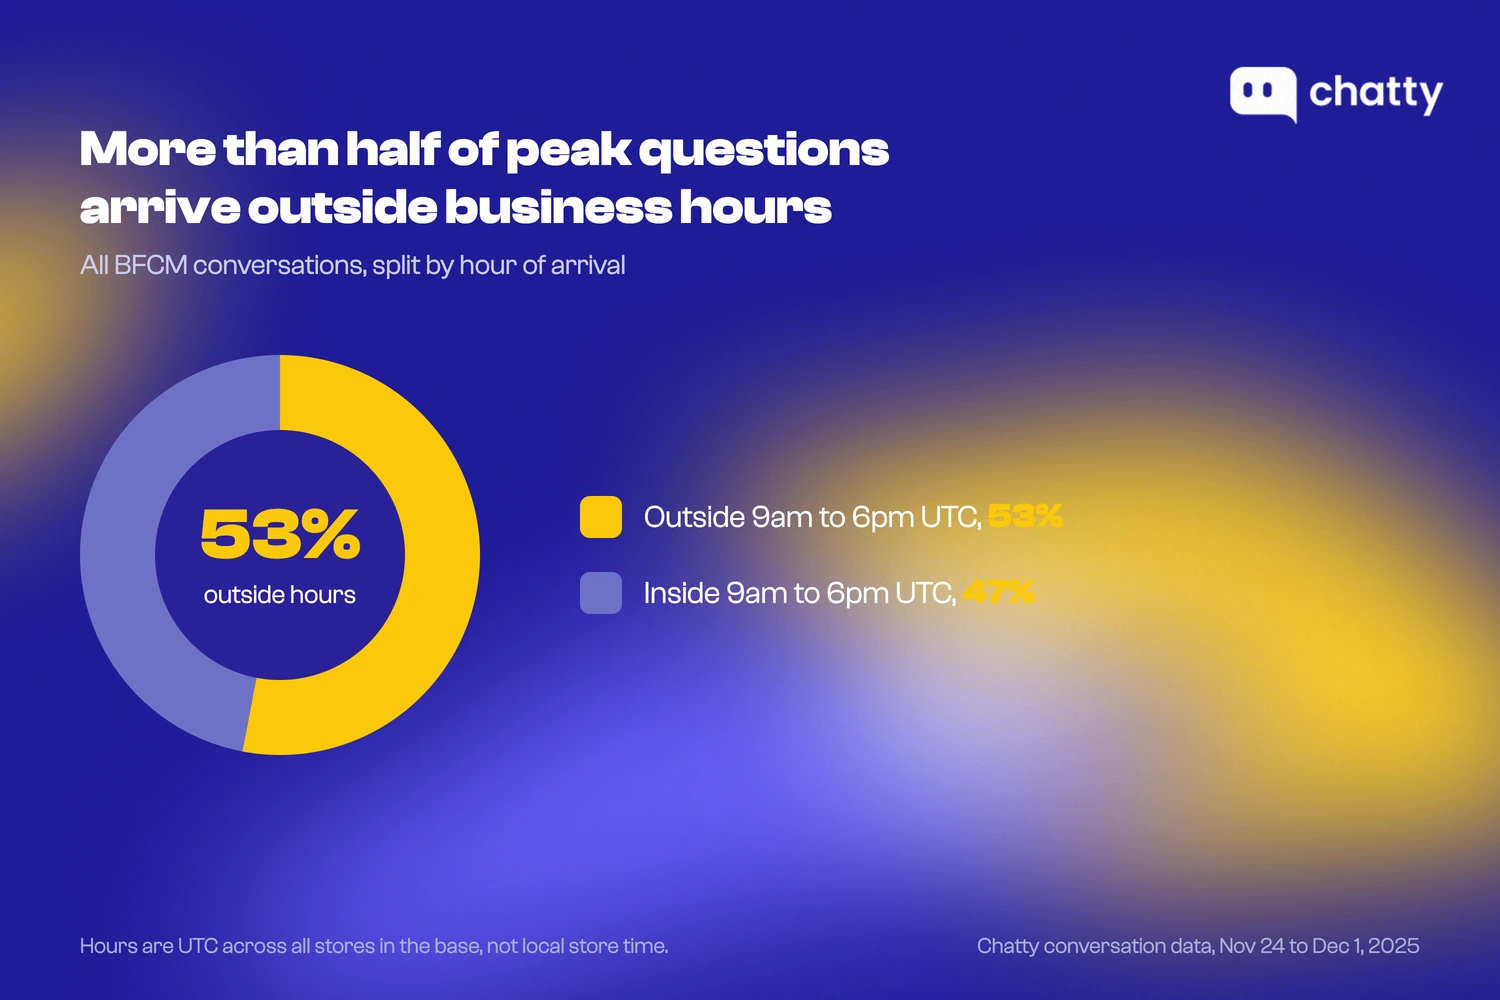
Hours are UTC across all stores in the base, not local store time.
Shoppers have already adjusted their expectations to match. 74% of consumers now expect 24/7 support, and they expect it because AI exists (Zendesk CX Trends 2026, p.10). The bar moved without anyone asking store owners first.
What to do with this insight
- Find your one busiest hour with nobody watching the chat. Look at when messages actually arrive: your chat tool's reports, or your Shopify order times as a rough stand-in if you don't have them. Find the hour with the most messages and no one online. Cover that hour first. It's the cheapest coverage decision on the table and almost nobody makes it on purpose.
- Decide what a shopper gets at 11pm, and write it down. "We'll get back to you tomorrow" is a placeholder, not an answer. If the answer already exists on your FAQ page or in your saved replies, it should never wait until morning. If it doesn't exist yet, name the hour someone will reply, not "soon". Chatty's human handover skill is on every plan including Free, so the overnight question is who picks it up, not whether a path to a person exists.
- Turn your five most common after-hours questions into saved replies this week. You don't need to be awake to answer a question you have already answered before.
Go deeper:
4. Shoppers did not change channels
A sale changes how many people write to you. It does not change where they write from.
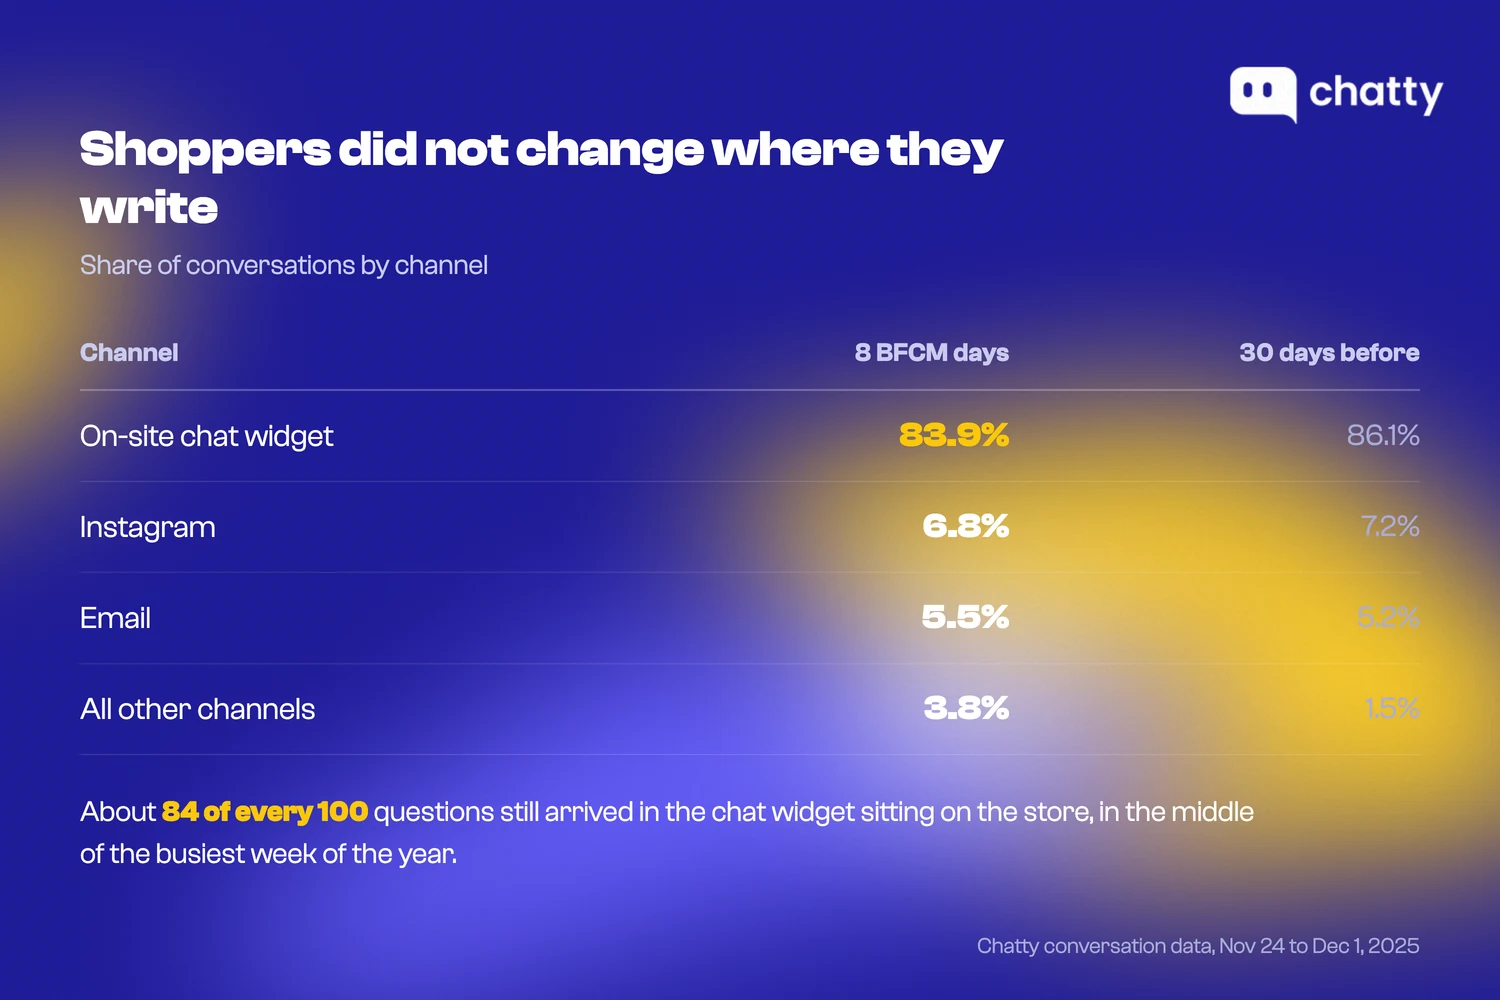
| Channel | 8 BFCM days | 30 days before |
|---|---|---|
| On-site chat widget | 83.9% | 86.1% |
| 6.8% | 7.2% | |
| 5.5% | 5.2% | |
| All other channels | 3.8% | 1.5% |
(Chatty conversation data, Nov 24 – Dec 1, 2025)
The mix barely moved. About 84 of every 100 questions still arrived in the chat widget sitting on the store, in the middle of the busiest week of the year.
Peak-season prep tends to drift toward whichever channel marketing is loudest on. The questions stayed home.
What to do with this insight
- Open your slowest collection page on your phone and try to start a chat. Not on desktop, and not on your fastest page. If the chat button is slow to load, sitting under a cookie banner, or gone since your last theme update, that is where your season breaks, and 84 of every 100 questions arrive right there.
- Re-check the chat after every theme or app change between now and Black Friday. It takes two minutes. Most stores find out it broke when the messages simply stop arriving.
- Put your prep where the questions are, not where the campaigns are. Marketing across email and text pays off. Shoppers reached on both viewed 71% more products (Klaviyo BFCM 2025 Recap). That is about where you reach people. Where they ask you things did not change when the sale started.
Go deeper:
5. Returns arrive in volume through the peak days
Return and exchange questions arrive in real volume during peak. After-sales conversations, covering returns, exchanges, warranty and complaints, came to 11.8% of classified conversations, which is 23,053 of them in eight days (Chatty conversation data, Nov 24 – Dec 1, 2025).
That volume lands in the part of the journey that tends to get the least written down. Buying questions get product pages and FAQ entries, order questions get tracking links. Returns often get a policy page, and then somebody reading it out loud, one shopper at a time.
How ready any given store is for that, this data cannot say. What it can say is how much of it arrives.
What to do with this insight
- Write your sale-season return terms as one paragraph with real dates in it. Not "see our return policy." The exact window for orders placed between these two dates, what is excluded, and who pays return shipping. Put it on your FAQ page and in the answers your chat can reach.
- Ask for a photo in your first reply, and make it a saved reply. 70% of shoppers will open their camera to verify a return, more than for a technical problem or assembly help (Zendesk CX Trends 2026, p.14). Most stores spend three messages describing the item instead of asking once.
- Name one person who can approve a refund during peak, and the amount they can approve without asking anyone. Two spike days, the bigger one 44% above normal, turn this from a policy question into a queue. A policy nobody is allowed to act on is just a delay with extra steps.
Go deeper:
- Knowledge base article template
- Customer service workflow process
- Help center: After-sales support skill
6. Satisfaction fell in the busiest week
Handling more conversations is not the same as leaving more shoppers happy. Across stores, the two moved apart in the same week.
Shoppers rate conversations at the end, and those end-of-chat ratings are the plainest read you get on whether the extra volume was handled well. Here is how they ran through the season:
| Week | Ratings | Positive |
|---|---|---|
| Nov 9 | 1,212 | 73.9% |
| Nov 16 | 1,634 | 73.9% |
| Nov 23 | 2,248 | 77.2% |
| Nov 30 (BFCM week) | 1,883 | 66.3% |
| Dec 7 | 541 | 68.8% |
(Chatty conversation data, Nov 24 – Dec 1, 2025)
Positive ratings climbed to 77.2% in the week before Black Friday, then fell to 66.3% in BFCM week, and only partly recovered after.
That same week held the 44% single-day peak. A shorter post-conversation survey moved the same direction, which is worth reading as a supporting signal, not a headline number.
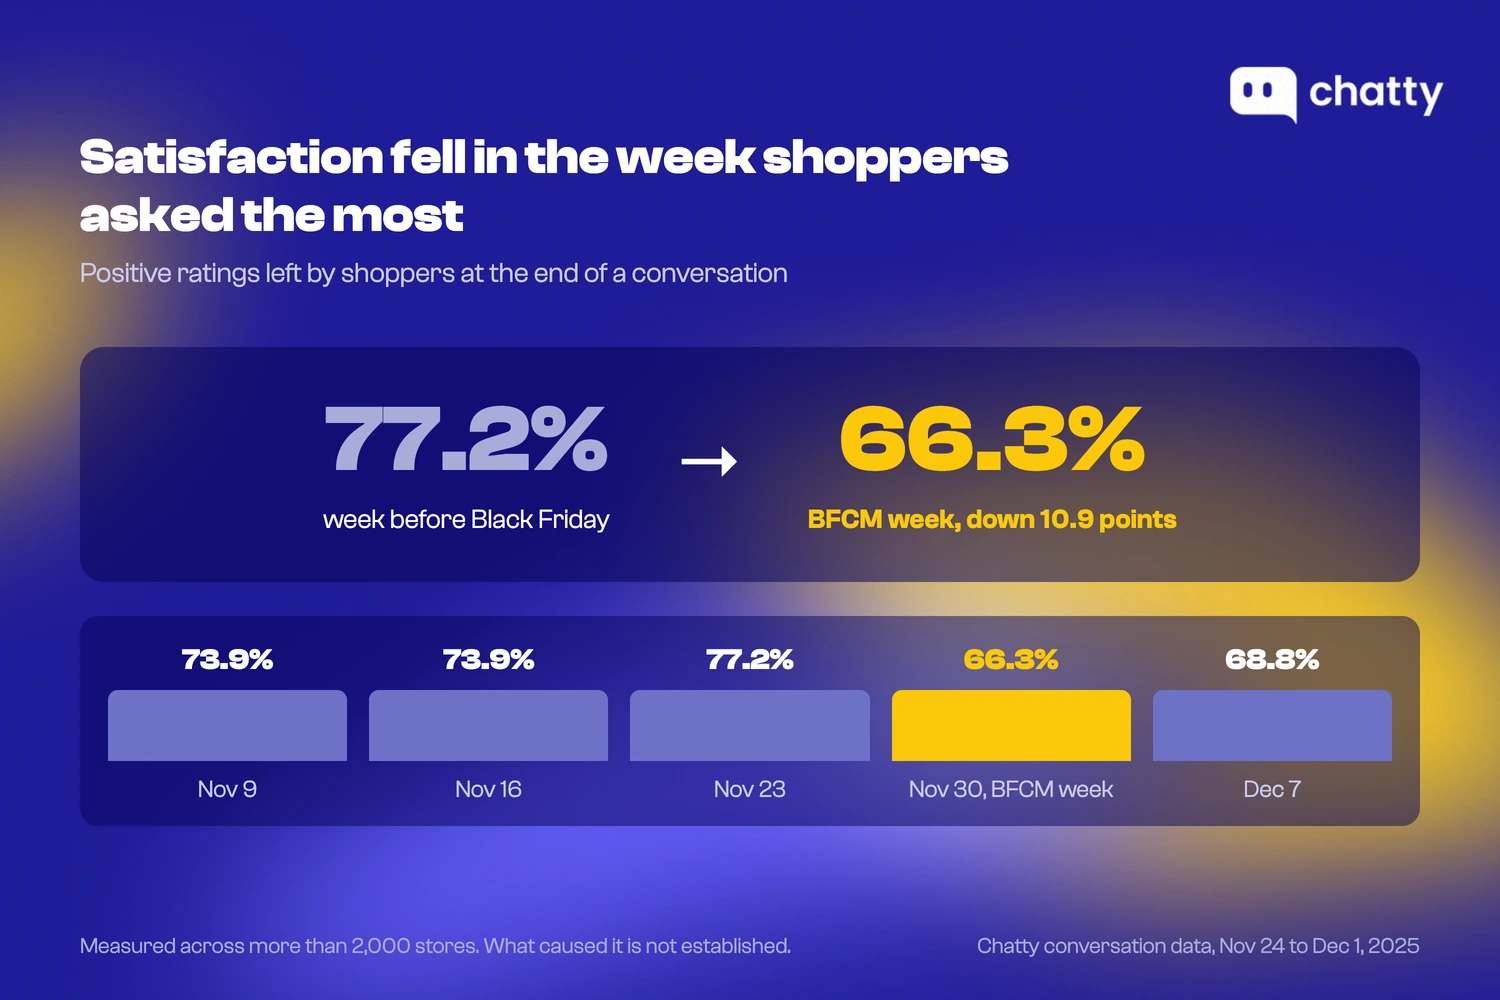
This is a market-wide pattern measured across more than 2,000 stores, not a verdict on any one store or any one tool. What caused it is not established, and this report does not guess. The honest reading is the pairing itself: the week with the most questions was also the week shoppers rated the answers worst.
What to do with this insight
- Change the number you report each week. Stop leading with how fast you replied. Report how many chats ended with the shopper's problem actually sorted. In Chatty that number is the Resolution rate on the Analytics tab.
- Look up your own satisfaction score for Black Friday week last year. Not the yearly average, that one week. It's in your chat tool's reports, or in your post-chat survey results if you run one. Across stores it fell from 77.2% to 66.3% that week and only partly came back. If yours did the same, that is the number you are trying not to repeat.
- Decide now what drop means "get another person on." Pick the number before Black Friday: five points, ten, whatever fits your store. Write it down and tell whoever is on the chat. Nobody makes that call well on the day it happens.
More chats handled is not more customers happy. Across stores last peak, those two moved in opposite directions in the same week.
Go deeper:
The last word
Put the six findings back together and a person shows up instead of a dataset. Here is what last peak season looked like from the shopper's side:
- They came to your chat to choose, not to check.
- They came in two waves, not in a steady stream.
- More than half wrote when your lights were off.
- They wrote from the same place they always do, your store.
- They came back after the sale to return something, in numbers worth planning for.
- They were less happy in the week they asked the most.
Fast is table stakes. Resolved is the score.
Score your own store
Three questions decide how your next peak week goes.
Can a first-time buyer get a real answer about which product to pick? Does a shopper who writes at 11pm on Black Friday get anything better than "we'll get back to you"? Does anyone in your store know what your satisfaction score did last peak week?
Answer them on your own store now, while there is still time to fix what comes back.
Numbers from real Shopify stores, updated October 2026
Methodology
This report is built from conversation data, not a survey.
- Window: November 24 to December 1, 2025, the eight peak days.
- Base: more than 2,000 Shopify stores using Chatty.
- Volume: roughly 580,000 conversations.
- Topic groups: assigned by automatic classification, not manual tagging. Topic percentages are shares of the conversations that were classified, not of all 580,000.
- Satisfaction: ratings left by shoppers at the end of a conversation, plus a smaller post-conversation survey used only as a supporting signal.
- Comparison baseline: the 30 days before the window.
One more thing to keep in mind. This is one season, eight days, with no second peak season to compare it against yet. Read it as BFCM 2025, not as every sale.
Frequently asked questions
Mostly they ask so they can buy. Product recommendations came to 19.3% of classified conversations, product comparisons to 8.7%, and promotions or discount codes to 8.5%, which is 36.5% together. Questions about an order already placed came to 26.1%, the largest single group but still smaller than those three combined (Chatty conversation data, Nov 24 to Dec 1, 2025).
It arrives as two spikes rather than a season-long ramp. Volume sat near 78,000 conversations a day in the week before, then one day in the last week of November hit 112,641, up 44%. The second spike, on Cyber Monday, came in at 106,140. Both times volume dropped close to baseline within two days.
53% of conversations landed outside 9am to 6pm UTC. Read that as a shape rather than as your own number, since the window pools stores across every time zone. It says questions spill well past business hours, not what hour your shoppers write.
No. 83.9% of questions arrived in the on-site chat widget during the eight peak days, against 86.1% in the 30 days before. Instagram sat at 6.8% and email at 5.5%, both close to their pre-peak share.
After-sales conversations, covering returns, exchanges, warranty and complaints, came to 11.8% of classified conversations, which is 23,053 of them in eight days. That volume lands during the peak window, not only in the weeks after it.
Yes. Positive ratings climbed to 77.2% in the week before Black Friday, then fell to 66.3% in BFCM week, and only partly recovered after. This is a market-wide pattern across more than 2,000 stores, not a verdict on any one store or tool, and what caused it is not established.